We asked Mike, one of our Support staff, to tell us about his experiences working with our preferred monitoring and management tool, Reveille. Over the past few years, Insight 2 Value has been using Reveille to monitor, manage and secure content management applications’ performance at customer sites and to support our managed services. Whether you use IBM, OpenText, Kofax, Box or Microsoft ECM products, Reveille can detect potential warning signs before they become incidents.
In this blog, Mike shares:
- Why he uses Reveille to help monitor customer systems
- What it can do
- Some real scenarios of how Reveille has helped solve a customer issue
- Tips and his Top 7 uses of Reveille
So, what were your first experiences with Reveille?
I got involved with using Reveille around the time version 8 (the latest) was installed in the first quarter of 2021. It was a pretty straightforward upgrade process from version 7. It was a case of downloading some files and just running through it, but care was taken to double-check everything as it was on a customer production machine. Once the installation was completed, there was some migration to do. From version 7 to 8, they have changed the dashboards from being called ‘score cards’ to now actually being called dashboards. There are also improvements for supporting ECM in Hybrid and Cloud environments.
Proactive Management
The goal for us in setting up Reveille is that rather than needing to log into customer systems daily via a VPN, everything is managed proactively. You get complete visibility in the dashboard of the customer’s entire ECM environment. Having set up monitors and tests in Reveille, any issues are forwarded to us so we can investigate. It’s a significant time-saving. Some VPNs can take a long time to connect. It is much easier to have issues sent to you.
The Dashboard

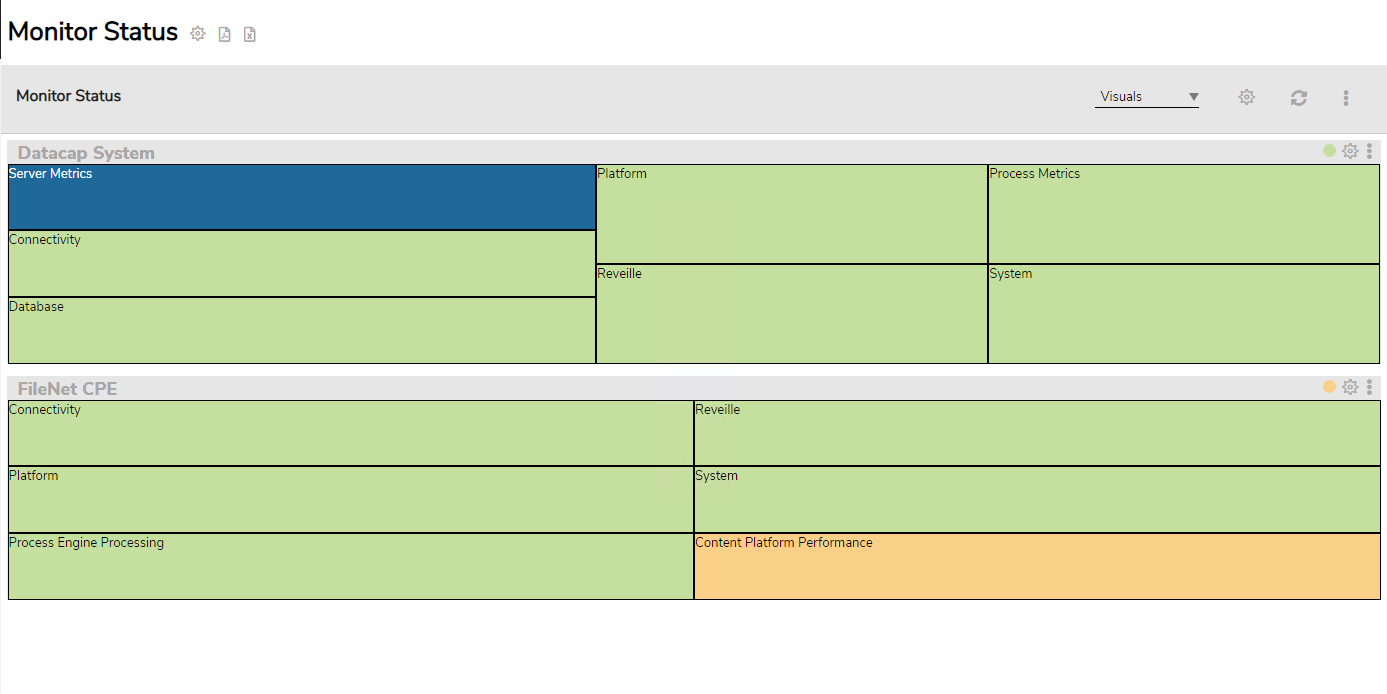
I like to set up the dashboard into categories. e.g. FileNet, three Datacap applications and Datacap systems. You can add friendly names to help navigate the customer’s entire environment more easily.
It also displays in the customer’s applications areas Corporate, IA and Retail. Previously, in Score Cards, it was just one giant list to look through. The new version allows you to nest things into folders. It’s much easier to navigate.
You can attach attributes to identify the different applications and show them on a graph. For example, on a graph, I can plot a line of each aborted batch in Datacap so I can quickly identify the application. You could have it all on one graph, but for me, it is visually easier to read arranged this way.
In addition, I have an overall dashboard that encompasses everything together rather than the three individual applications.
Scheduling a daily report
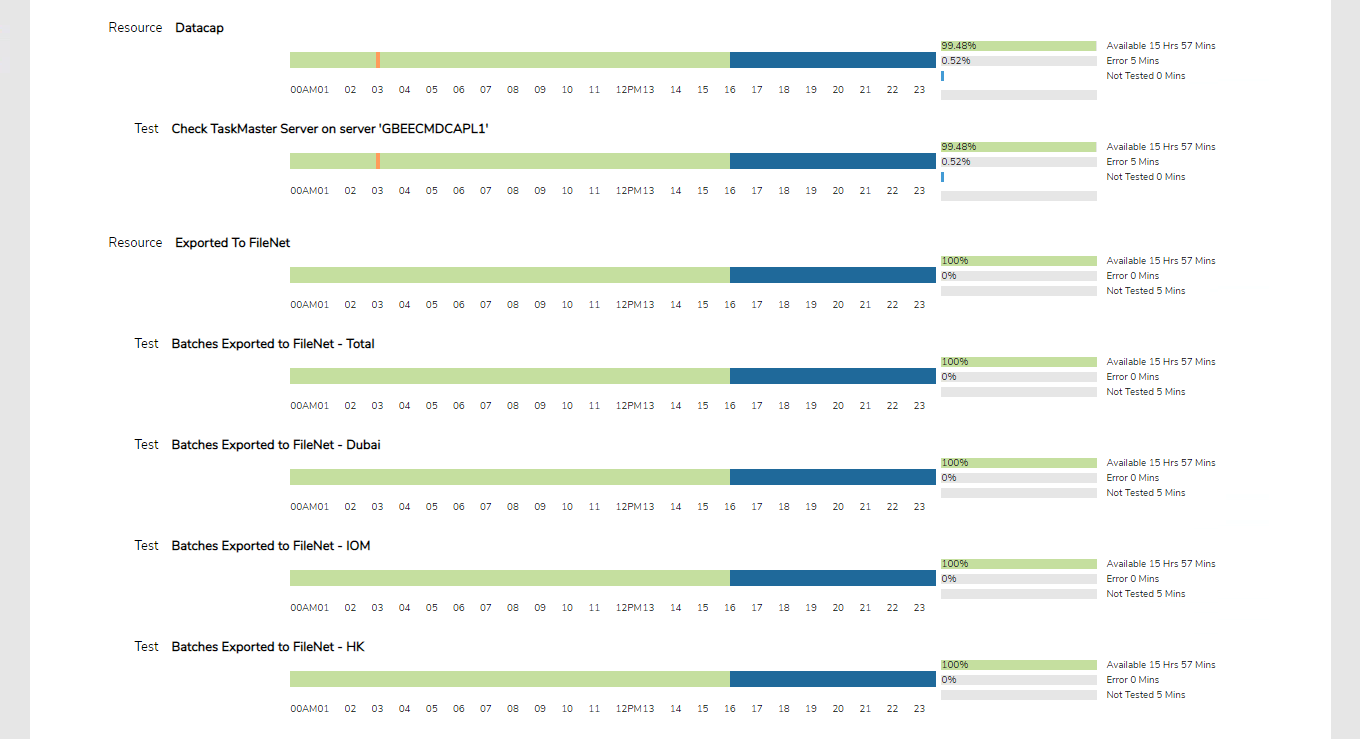
I’ve set up a scheduled task to send me the previous day’s report in a pdf document at a quarter past midnight. The report is as long as the tests you’ve enabled. You can choose not to show everything, but I’d rather see everything all at once; therefore, it is 18 pages long for a particular customer. It’s not actually a lengthy read because it is colour coded. It saves me from going on their system to check the other tests.
In Reveille, you have resources, monitors and tasks. The tasks are the individual checks on each thing. I have the availability one sent so I can see for the day when it’s failed, the severity and for how long. It also sends me a list of every single task, every monitor, and every single resource, all broken down. In addition, that gets emailed to the IT help desk once a day for the previous day. I prefer to have the report with the full day of the previous day rather than half-finished data, but it is pretty configurable to set up as you like.
Effectively, we are automating the managed service process, and we don’t have to contact the customer very often, which helps them and us.
The Report

The reports show daily availability, and I’ve chosen to include everything from the previous day. It’s a bit like looking back in the rear-view mirror. You’ve got the hour segments throughout the day, from morning till midnight. It tells you how long it was available, how long there was any issue, and whether it was tested. At the top, it gives you a summary. Then it breaks it down into groups.
Right now, some of the tests are still not set up, or there are some legacy tests we have not yet removed. So, some of them aren’t green. Green is good. Everything else is bad. Well, other than blue – blue means I’ve turned the test off 🙂.
FileNet tests
I’ve got all sorts of tests set up for FileNet – Connectivity, availability; you name it, Reveille can do it. There’s a test that runs through an end-to-end test of creating a folder in the object store, adding a document, renaming it, deleting the document and then deleting the folder to ensure it’s all working.
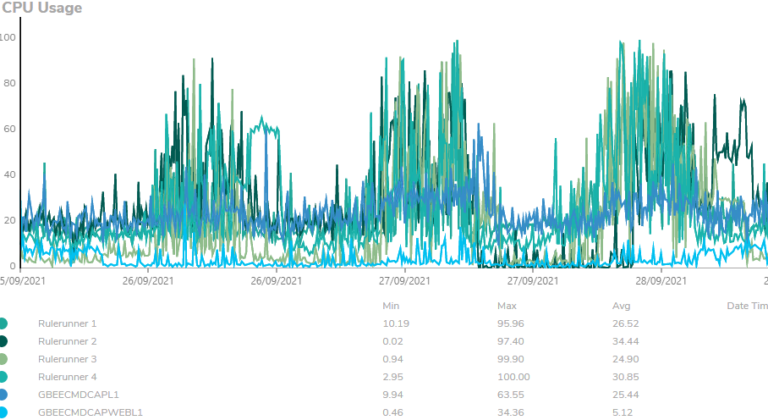
And then, performance-wise, we have tests for CPU, memory, storage space, response times and any API’s. You can test anything – if it’s got a number, you can test it!

This is probably the most helpful thing I’ve managed to set up. It eliminates my need to go on the system unless there’s a problem. If you’ve got X number of customers all managed, it takes time to log in to each system and check that everything’s okay. It is so much easier to get an email in the morning or at set periods.
The Mailbox
The mailbox is where everything goes – reports and tickets too. It can get a bit spammed up with ‘Do Not Reply’ emails when something does go wrong. For example, today, we had 112 emails showing the output of the tests. This showed that the percentage of free space on E drive exceeds 15% remaining. Potentially that could be a situation where you would have to go and clear things out manually. However, we’ve automated a lot of stuff. So, in this case, it clears it out itself. We have set up Datacap to delete old batches more than three days old as the content would be in the FileNet system at that point. It’s fairly standard for customers to do that; we have other customers who keep batch data for the same length of time.
So, overall using Reveille, we can pinpoint areas of concern, and then we can tweak the config accordingly so that we can manage it better.
Maintenance Tests
On Saturday, the customer had their scheduled maintenance. Everything was reset, and there was a tonne of emails on all sorts of errors that came through. We used Reveille to do retests more frequently – from every 15 minutes down to every one or two minutes until the errors were resolved. Obviously, when something goes wrong unusually, you need more information faster until everything is resolved. It is beneficial for that.
SLA Reports
You can configure what’s acceptable and not acceptable in the survey section and include that on reports for the customer.
Monthly production reports
I’m currently working on automating the production of monthly reports for the customer. We do a volume health check, so I’m preparing that. Ideally, I want to take the entire health check and put it online so that they can see it whenever they wish to and update it as often as the matrix.
One issue I’ve recently come across is that currently, it seems I can only display metrics, and it would be nice if I could show some standard text on the report page. For example, one of the tests we do in the health check is to report what version of Datacap it is on. This is very easy to find out with a script through power shell, but I can’t seem to display that anywhere on the Reveille dashboard.
Can you give an example of a recent issue which Reveille helped you resolve?

Yes. With one of our customers, we had a poor performance issue following an upgrade. We could see that real-time transaction counts were down and that for some users, opening documents took 30-60 seconds at a time.
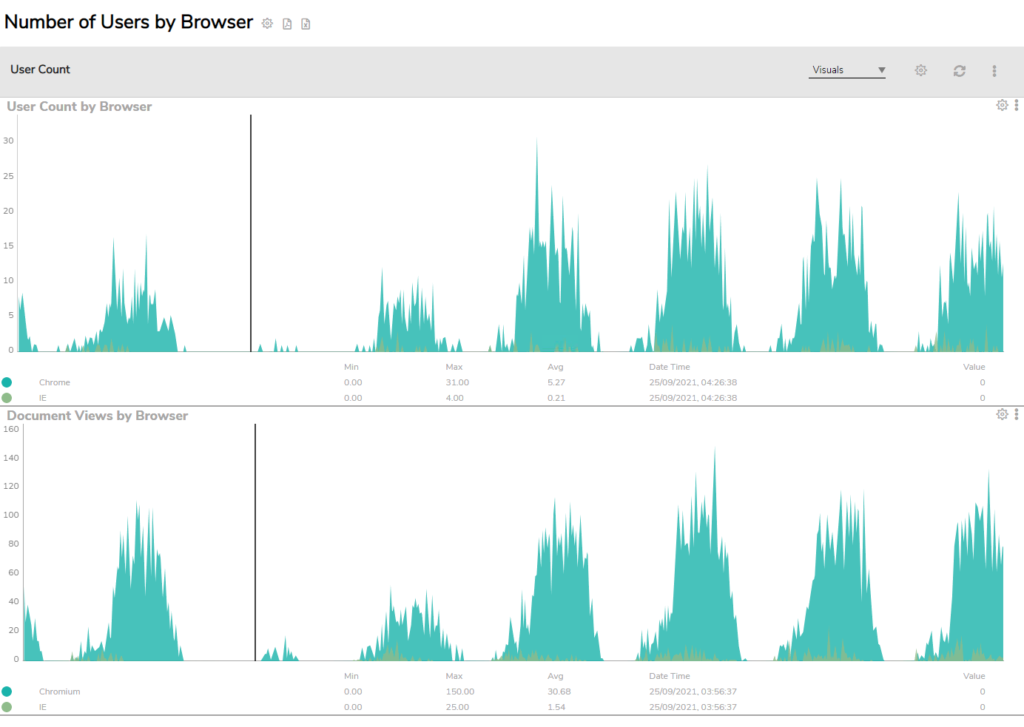
Adding some extra attributes to Reveille allowed us to monitor and track what was happening in real-time. We tracked what browser people were using and their location to see if it was just general latency or for one section of people.
It looked like it wasn’t a location-specific problem but that the issue was for users using Internet Explorer. So, then we did some A/B testing with Internet Explorer and Edge. It confirmed that Edge was performing better, and we could then recommend to the customer that everyone should transition to Edge. They agreed. Without Reveille, it would have been hard to get to the issue and prove it.
In summary, what are your Top 5 uses of Reveille’s proactive monitoring and management?
Here’s my Top 7 🙂
- Are the servers available?
- Checking storage space and CPU performance
- What are the response times for any APIs?
- Real-time transaction counts in FileNet. Are there any poor performance issues?
- Being able to add attributes to find out further information on an issue – e.g. what browser is an end-user using? Where are they located?
- Alerts when something goes wrong, e.g. when a batch abort in Datacap or a service level is not being met.
- Writing rules for standard recoveries – e.g. If a thread crashes more than ten times in a minute, automatically reset the rule runner.
Overall benefits
Customers are happy that we’re keeping their systems more stable for longer. Here in tech support at Insight 2 Value, Reveille makes our lives easier and helps us to be proactive and reactive. It saves us hours of checking multiple systems!
Thank you, Mike, for taking the time to share your experiences with Reveille. If you’d like to find out more or to see a demonstration Contact Us


